At a Glance
- Built a real-time platform aggregating Twitter, news, and search data to map gun violence incidents across the United States.
- Provided up-to-the-minute, state-by-state data on shootings to inform the public and support evidence-based policymaking.
- Innovatively used digital “exhaust” (social media and web data) to fill gaps in official gun violence reporting and awareness.
Visual highlights
The Problem
- Official gun violence data was delayed and fragmented, hindering timely awareness of ongoing incidents.
- The public lacked an accessible, up-to-date source for localized gun violence information and trends.
- Policymakers had insufficient interim data between official reports to gauge the effects of policy changes on gun violence.
The Solution
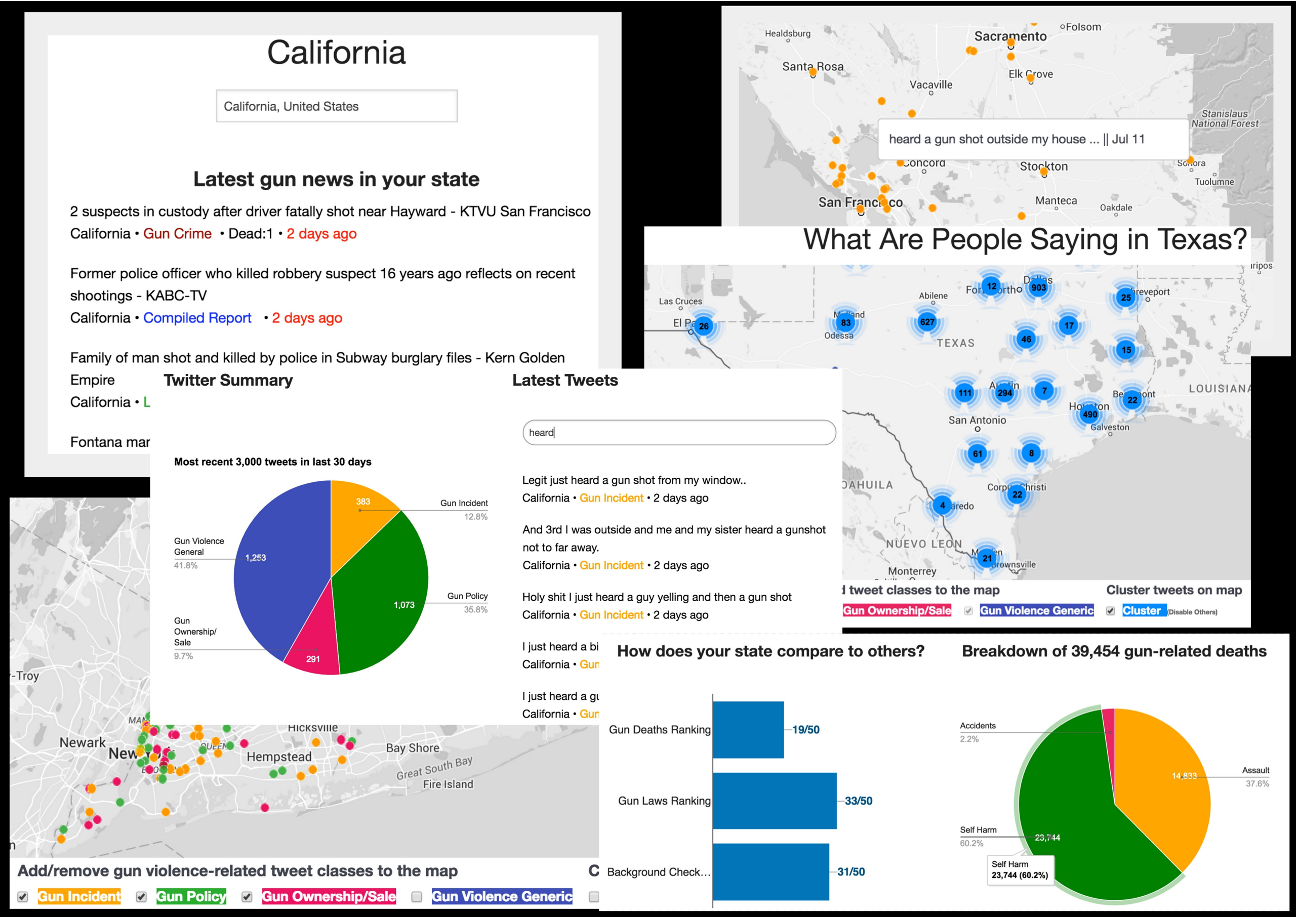
- Developed an interactive web dashboard that combines multi-source data (social media posts, news reports, and Google search trends) on gun incidents in near real time.
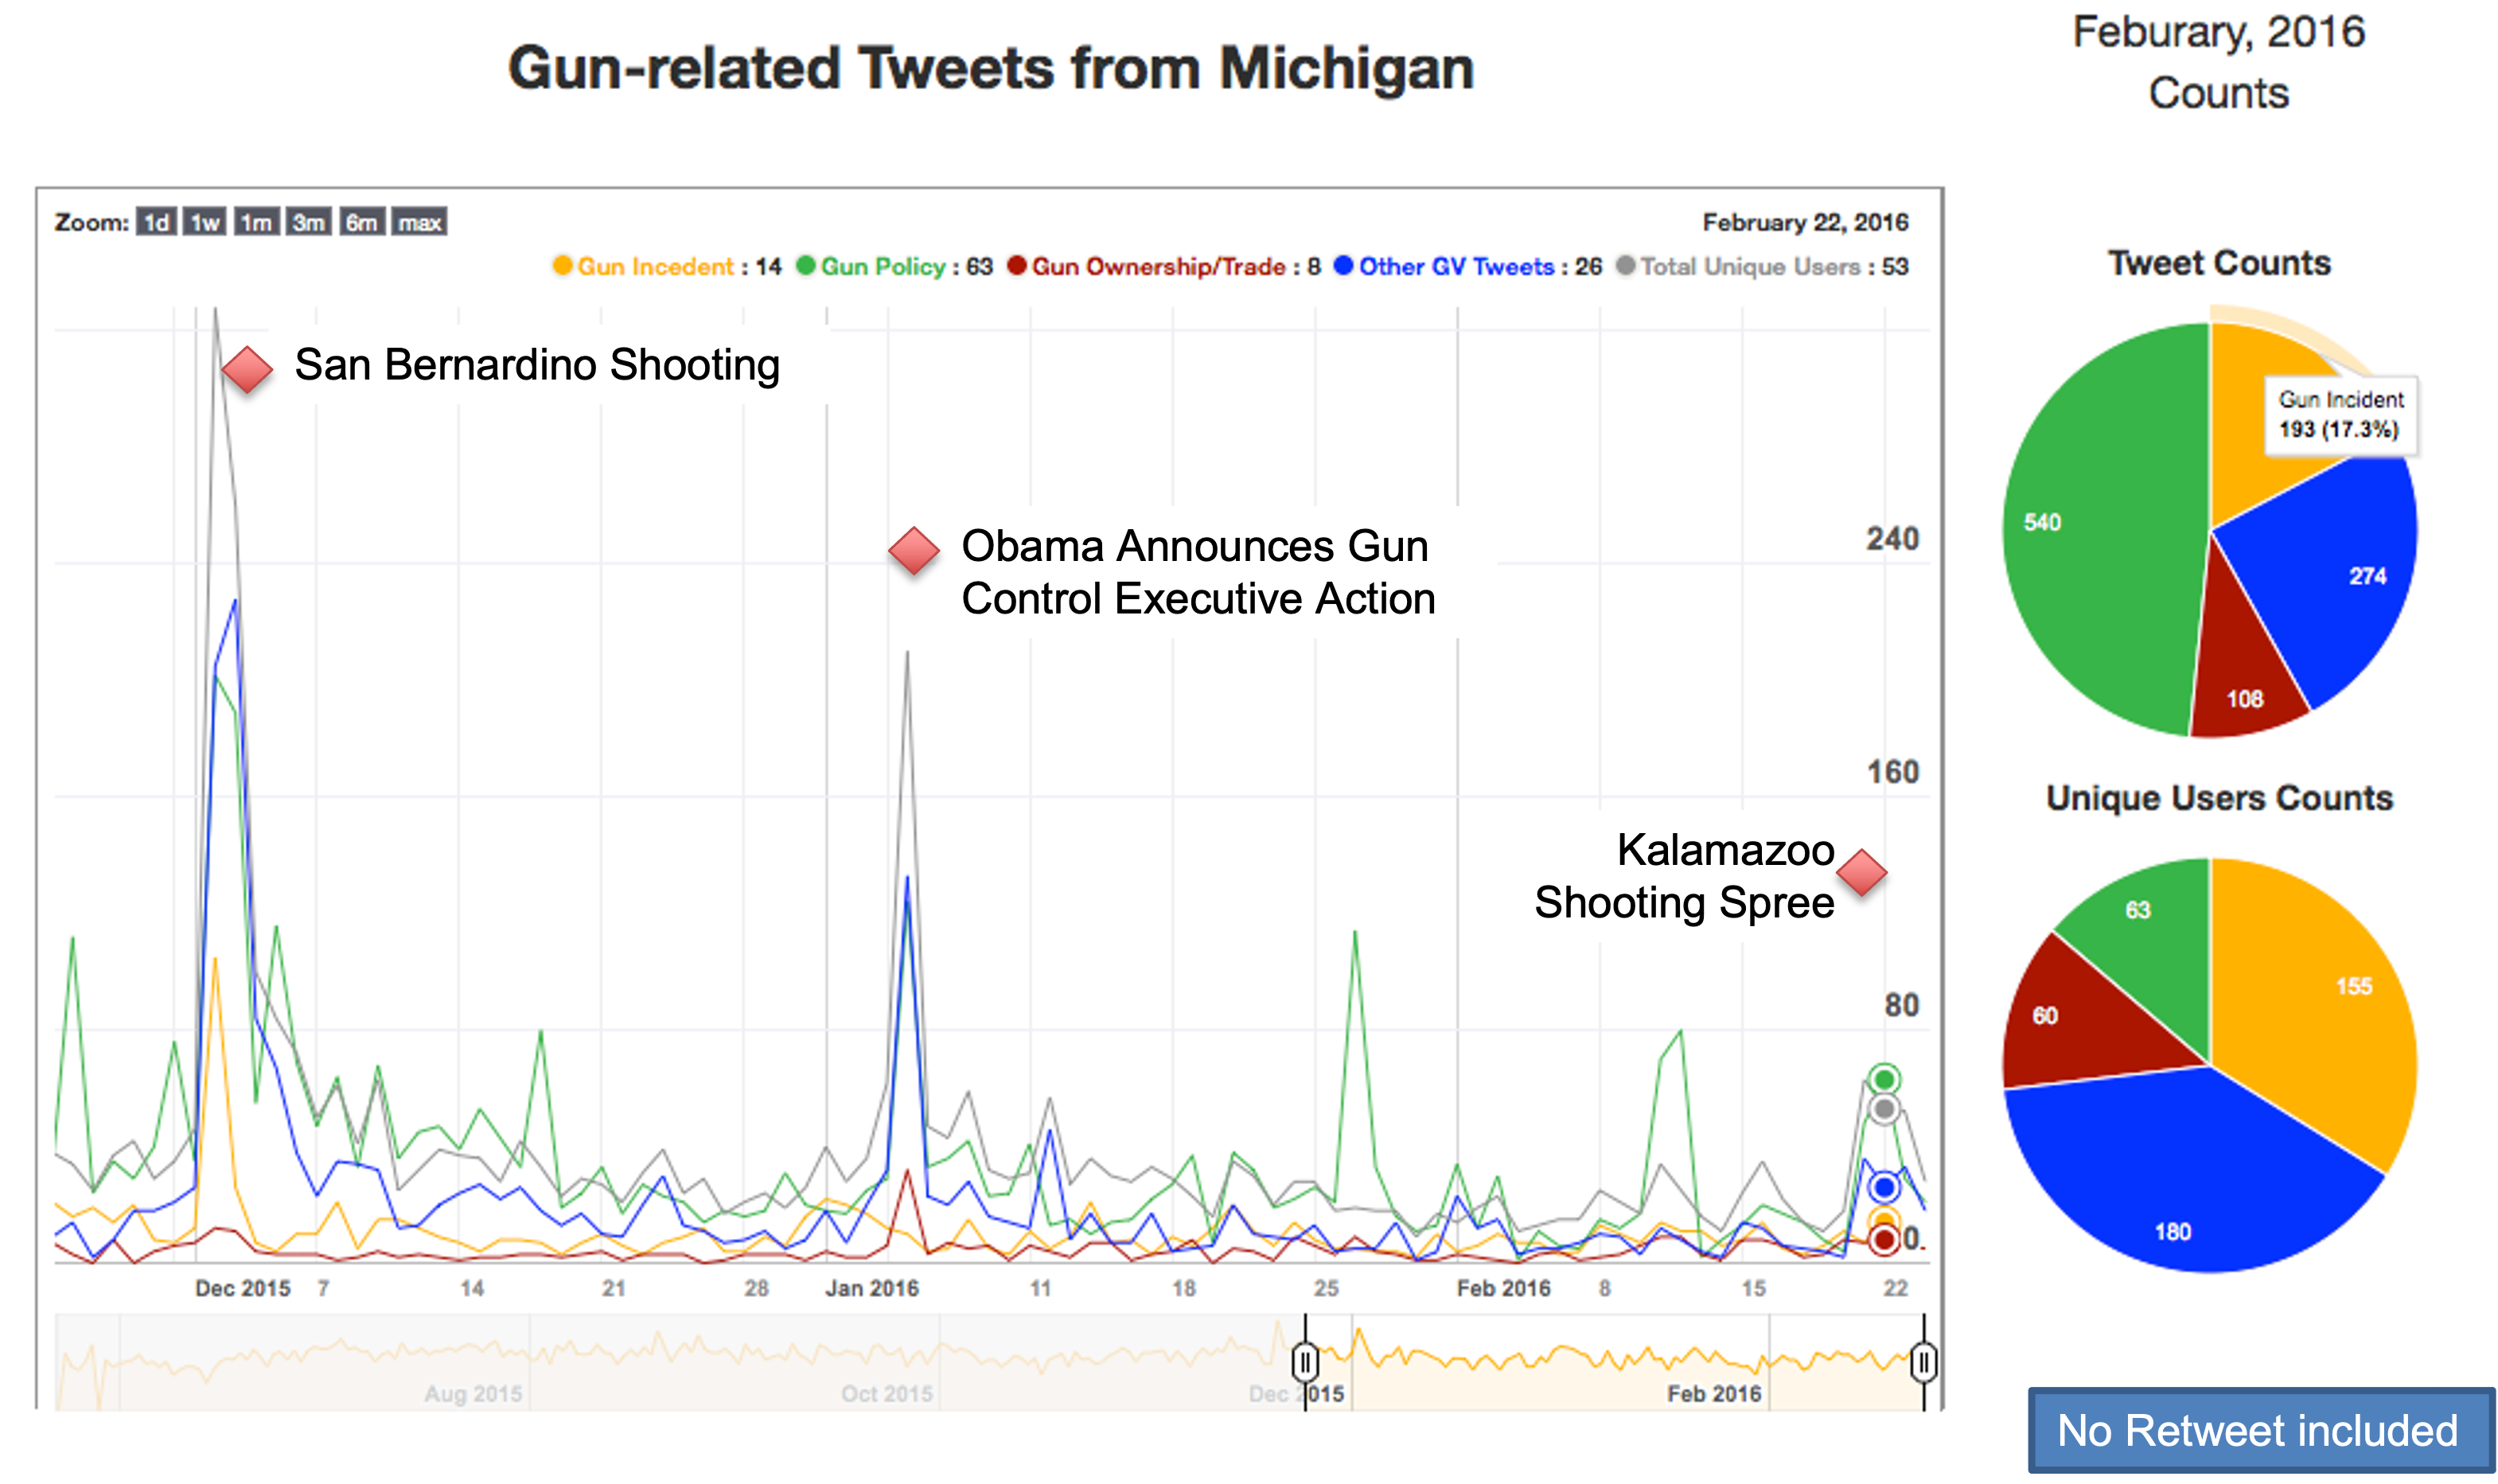
- Implemented machine learning to categorize gun-related tweets (e.g., distinguishing incident reports vs. discussions) and to classify news articles by type of incident.
- Geocoded all data to the state level and integrated official metrics (e.g., gun death rates, background check stats) to provide contextual insights alongside the live incident feeds.
Architecture Overview
- Multi-Source Ingestion: Pipelines continuously pulled data from Twitter (streaming API for gun-related keywords), Google News feeds (for relevant articles), and Google Trends (for spikes in gun-related searches).
-
ML Classification Pipeline: Automated tagging of content –
grouping tweets into four topical categories and news articles
into seven categories of incidents – for structured analysis.
- Gun Incident: Tweets about any US-based gun-related incident. These incidents may include: gunshot heard, gun homicide or suicide, armed robbery, gunmen or active shooter condition, etc.
- Gun Ownership/Sale: Tweets about gun shows or gun transactions, or tweets expressing positive or negative sentiments about gun ownership or gun sales.
- Gun Policy: Tweets expressing positive or negative sentiments about the gun policies or simply comparing them with that of other states or countries.
- Gun Violence Generic: Tweets that express sentiments about or attempt to spread awareness on gun violence in general. Tweets discussing gun violence from outside US are excluded.
- Human-in-the-Loop Curation: A small analyst team reviewed the machine outputs to verify classifications, remove duplicate reports, and annotate developing stories, ensuring data quality and reliability.
- Geolocation Engine: Each tweet and news item was mapped to a U.S. state (using text location cues and a geocoding API) so that the dashboard could display state-by-state incident summaries.
- Dashboard Front-End: A public-facing map and timeline interface updated live, showing each state’s recent incidents, trends over time, and comparisons to official statistics, all in one place.
Results and Impacts
- Tracked ~540,000 gun-related tweets and ~1,600 news articles per month during 2015–2016, demonstrating the system’s ability to handle high-volume, real-time data.
- Deployed the public site Gunviolencemap.org, giving citizens and officials a live, interactive view of gun violence trends by state (a first-of-its-kind public tool).
- Project garnered national attention: it was presented at SXSW 2016 and featured by media outlets (e.g., Wired, KQED) for its novel approach, thereby raising awareness and informing public debate on gun violence.
Skills and Tools Used
| Technique/Skill | Tools/Implementation |
|---|---|
| Data Sources | Twitter API, Google News RSS feeds, Google Trends data |
| ML & NLP | Text classification models for tweets and news content |
| Geospatial Tech | Google Maps API for geocoding and state-level mapping |
| Web Development | Interactive dashboard (HTML/JavaScript) for real-time visualization |
| Hybrid Curation | Combined automated classifiers with human review for accuracy |
Cross-Project Capabilities
- Real-Time Social Data Mining: Techniques for live social data tracking developed here were later applied to health domains (digital disease surveillance).
- Reusable Pipelines: The Twitter ingestion and classification pipeline was repurposed in other projects (e.g., patient experience sentiment analysis in healthcare).
- Integrated Data Dashboards: Experience merging diverse data streams (social media, open data, official stats) into unified platforms is leveraged in projects requiring multi-source analytics.
Published Papers/Tools
- Live Platform: Gunviolencemap.org launched as a public interactive tool (featured by news outlets), providing an ongoing resource for stakeholders and the community.The Guardian KQED
- Public Outreach: Invited talk at SXSW Interactive 2016, “Using Social Media to Predict Gun Violence,” which disseminated the project’s approach to a broad audience.SXSW Talk