At a Glance
- Created a geospatial analytics platform that fuses data from multiple landmine detection sensors into a unified risk heatmap.
- The interactive dashboard highlights likely landmine hotspots, enabling demining teams to prioritize and track clearance operations more effectively.
- Designed a modular system architecture allowing new algorithms or sensors to be added without disrupting the whole platform.
Visual highlights
The Problem
- Fragmented data: Each landmine detection sensor (e.g., metal detectors, ground-penetrating radar, drones) produced separate data, making it hard to see the overall mine risk landscape.
- High false positives from sensors wasted teams’ time on non-threats, underscoring the need for smarter data analysis to filter out “noise.”
- No real-time geospatial tool existed to help mission planners decide which suspected mine areas to clear first, leading to less efficient use of limited resources.
The Solution
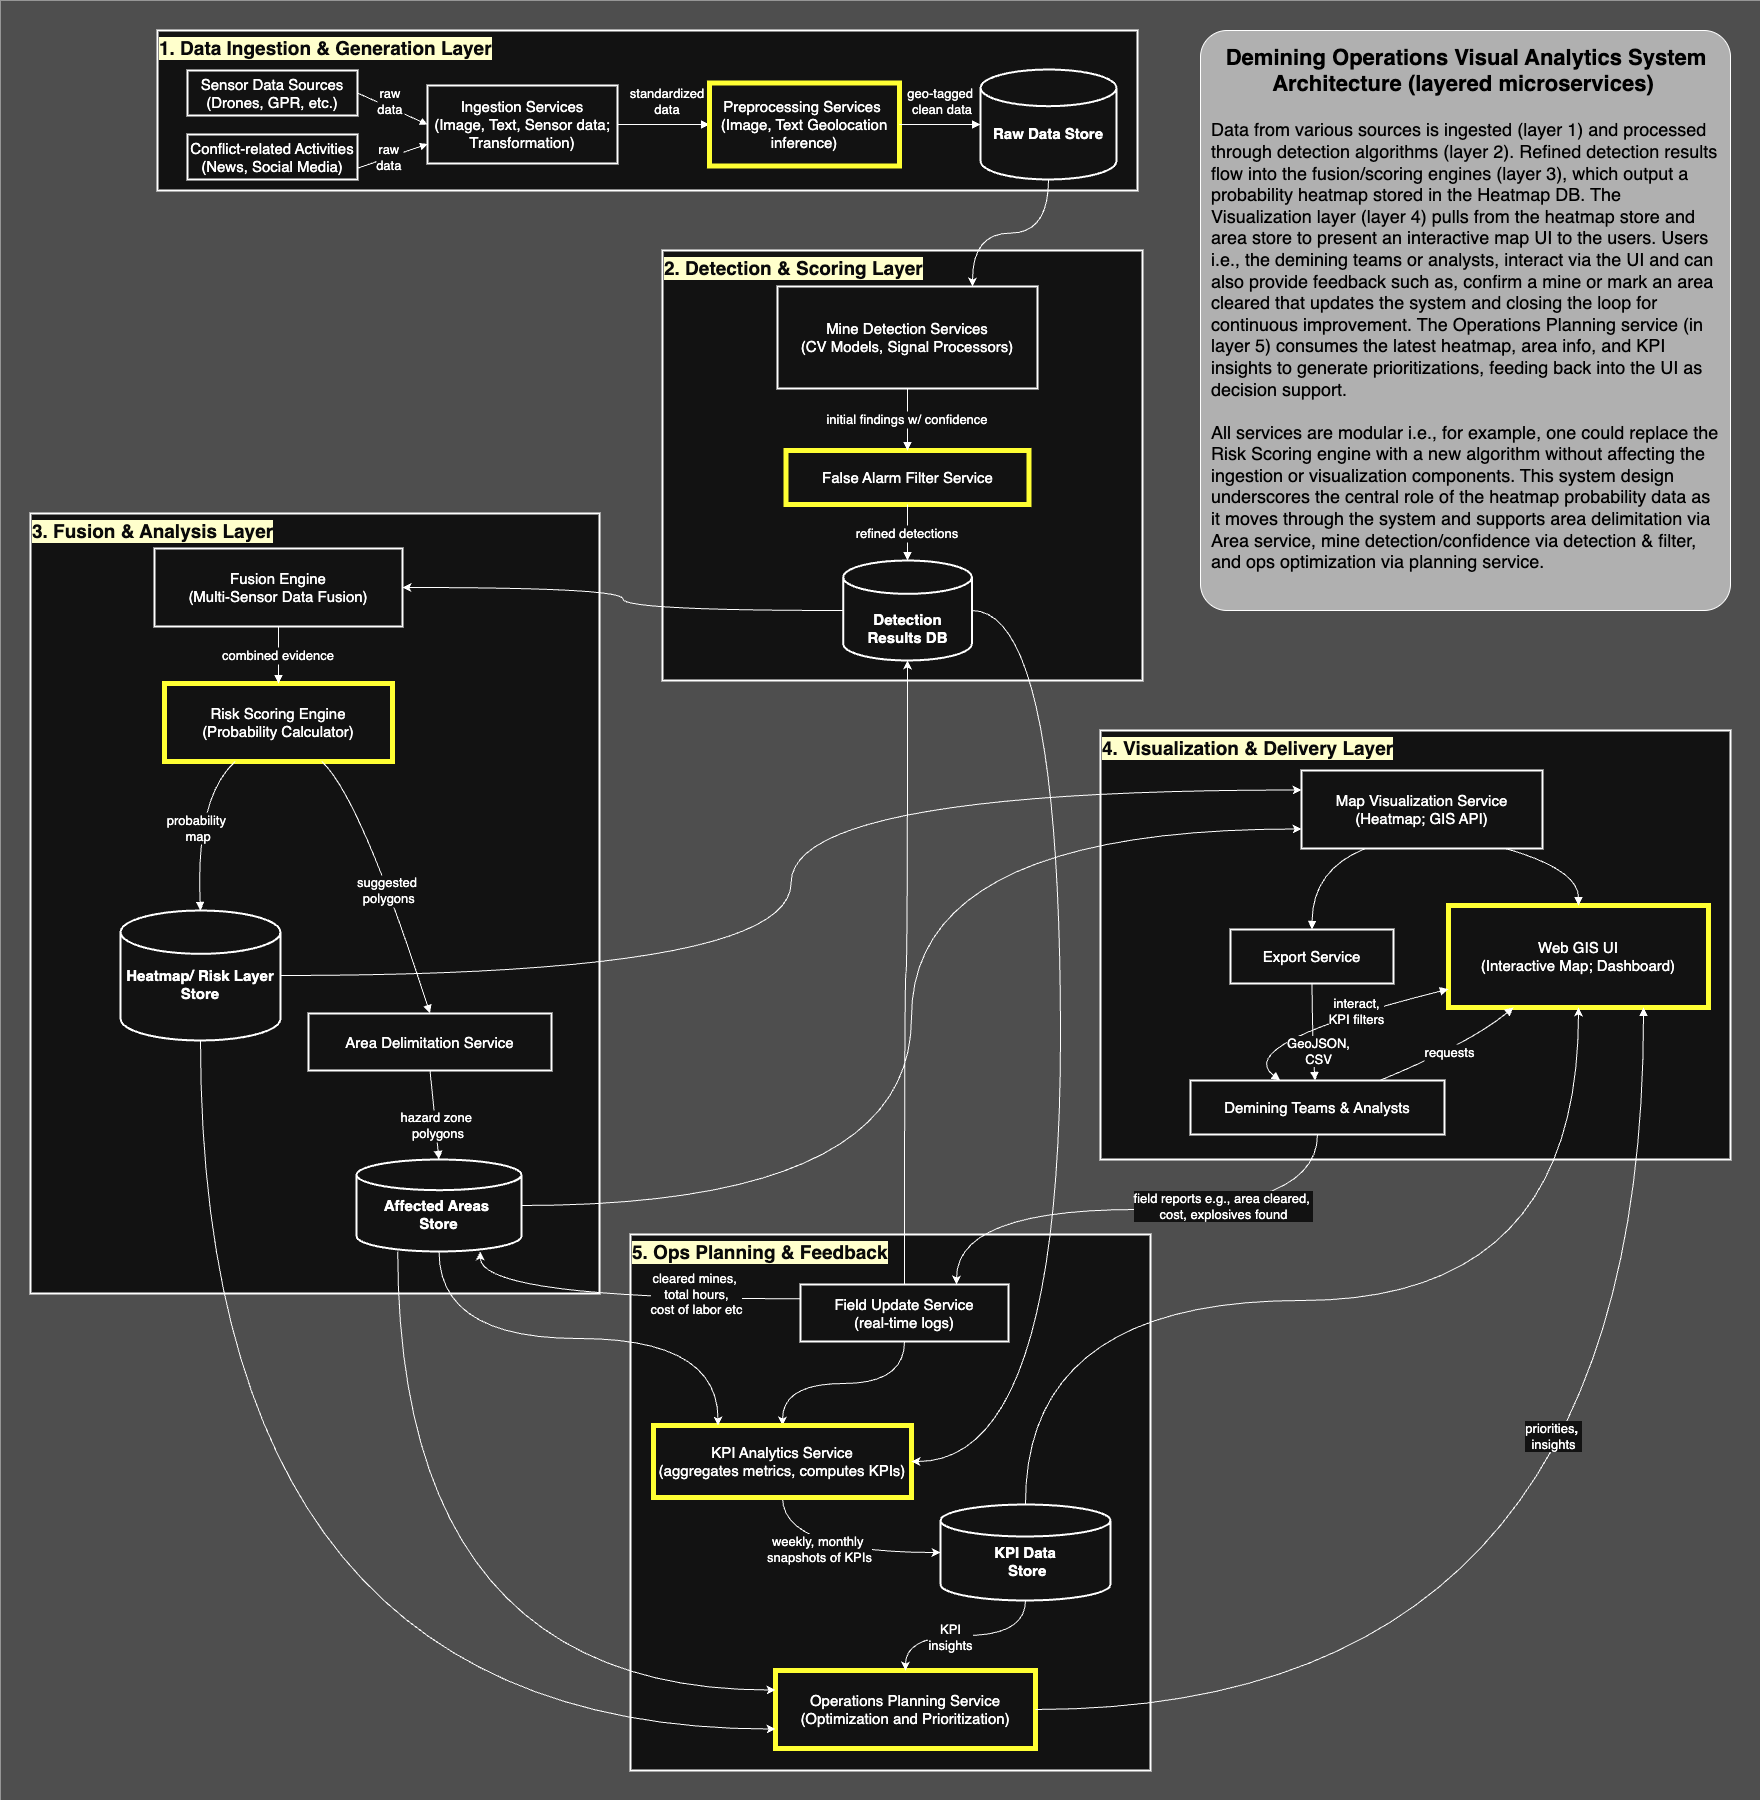
- Architected a five-layer microservice system to ingest various sensor data streams, analyze and fuse them, and present the results in a cohesive way.
- Continuously generated an updated probability heatmap highlighting likely mine locations (“hot zones”), serving as the core decision-support visual for teams.
- Incorporated field feedback (reports of found or cleared mines) back into the model, so the system learns over time and improves its predictive accuracy.
Architecture Overview
- Layered Microservices: Separate services handled data ingestion from each sensor type, data fusion and analysis, risk modeling, user feedback integration, and the user interface.
- Heatmap Generator: The analysis engine produced a geospatial probability heatmap of landmine presence, updating in near real time as new sensor readings and field reports came in.
- Interactive Map UI: A front-end map dashboard allowed users to explore high-risk areas, see details on each zone (e.g., sensor readings, last sweep date), and view progress over time as areas are cleared.
- Feedback Loop: A dedicated module took input from demining teams (confirmed mine finds or cleared areas) and fed that data back into the risk models, continuously refining the system’s predictions.
- Planning Module: An operations planning service combined the latest risk map with external data (terrain, accessibility, team locations) to suggest which suspected areas to address next for optimal safety and efficiency.
Results and Impacts
- Delivered a complete system design for a next-generation demining decision-support tool, demonstrating how modern data integration can improve mine clearance strategy.
- Stakeholders in humanitarian demining reviewed the prototype positively, and plans were initiated to pilot the dashboard in a real demining field operation.
- Highlighted how advanced analytics and AI can significantly enhance safety and efficiency in post-conflict demining, influencing organizations to invest in smarter demining technologies.
Skills and Tools Used
| Technique/Skill | Tools/Implementation |
|---|---|
| Sensor Data Fusion | Combined outputs from multiple detection sensors (metal detectors, GPR, drones) |
| Microservice Architecture | Modular system design for ingestion, analysis, feedback, and visualization |
| Geospatial Analytics | Heatmap generation and spatial risk modeling (GIS tools) |
| Continuous Learning | Integrated field feedback loops to update risk models in real time |
| UI/UX Design | Interactive map dashboard for mission planning and progress tracking |
Cross-Project Capabilities
- Modular Architecture: The five-layer microservice approach exemplifies a scalable design pattern Dr. Tuli applies in various domains (from healthcare dashboards to security analytics).
- Real-Time Geospatial Analysis: Skills in creating live risk maps here transfer to other projects involving spatial data (e.g., epidemic spread mapping, environmental monitoring).
- Continuous Improvement Loop: Experience building feedback loops (learning from new field data) is leveraged in other ML systems to ensure they adapt and remain accurate over time.
Published Papers/Tools
- Design Documentation: Produced an internal white paper and architecture presentation detailing the demining dashboard design (2025).
- Early-Stage Project: This was a prototype/plan for humanitarian organizations, so no public release or academic publication was made at the time of writing.