At a Glance
- Collected and analyzed 2.76 million patient experience tweets (2013–2017) from across the US.
- Found that patient sentiment became less negative nationwide over time, with distinct urban-rural and daily patterns.
- Demonstrated that Twitter can serve as a real-time, large-scale barometer of patient healthcare experiences.
Visual highlights
The Problem
- Existing surveys are infrequent, biased, and lack real-time nationwide patient feedback.
- Healthcare providers needed timely insights into patient satisfaction and concerns.
- Without alternate data, shifts in patient sentiment could remain undetected by stakeholders.
The Solution
- Collected 27.3 million tweets (2013–2017) via Twitter’s API using patient experience keywords.
- Built an automated pipeline with a tweet classifier, geolocation engine, and sentiment analyzer.
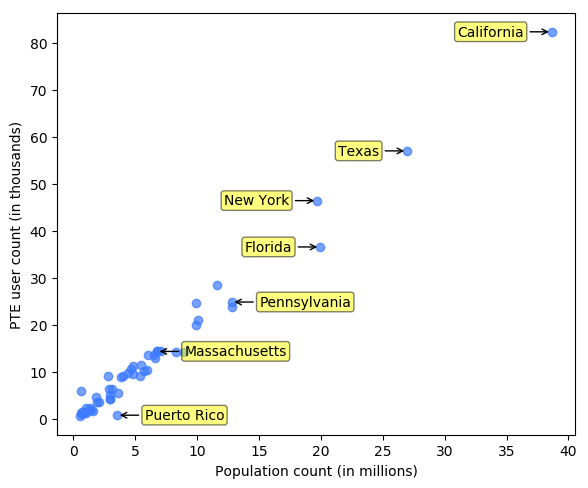
- Filtered 2.76 million relevant patient-experience tweets and geolocated ~32% to US states.
Architecture Overview
- Used continuous tweet ingestion with keyword filters (excluding URLs for relevance).
- Classified tweets with an SVM-based model to identify patient experience content.
- Geolocated tweets to states using profile text and Google Maps API.
- Performed sentiment analysis (positive/neutral/negative) on each relevant tweet.
- Aggregated data into a dashboard for temporal and geographic visualization.
Results and Impacts
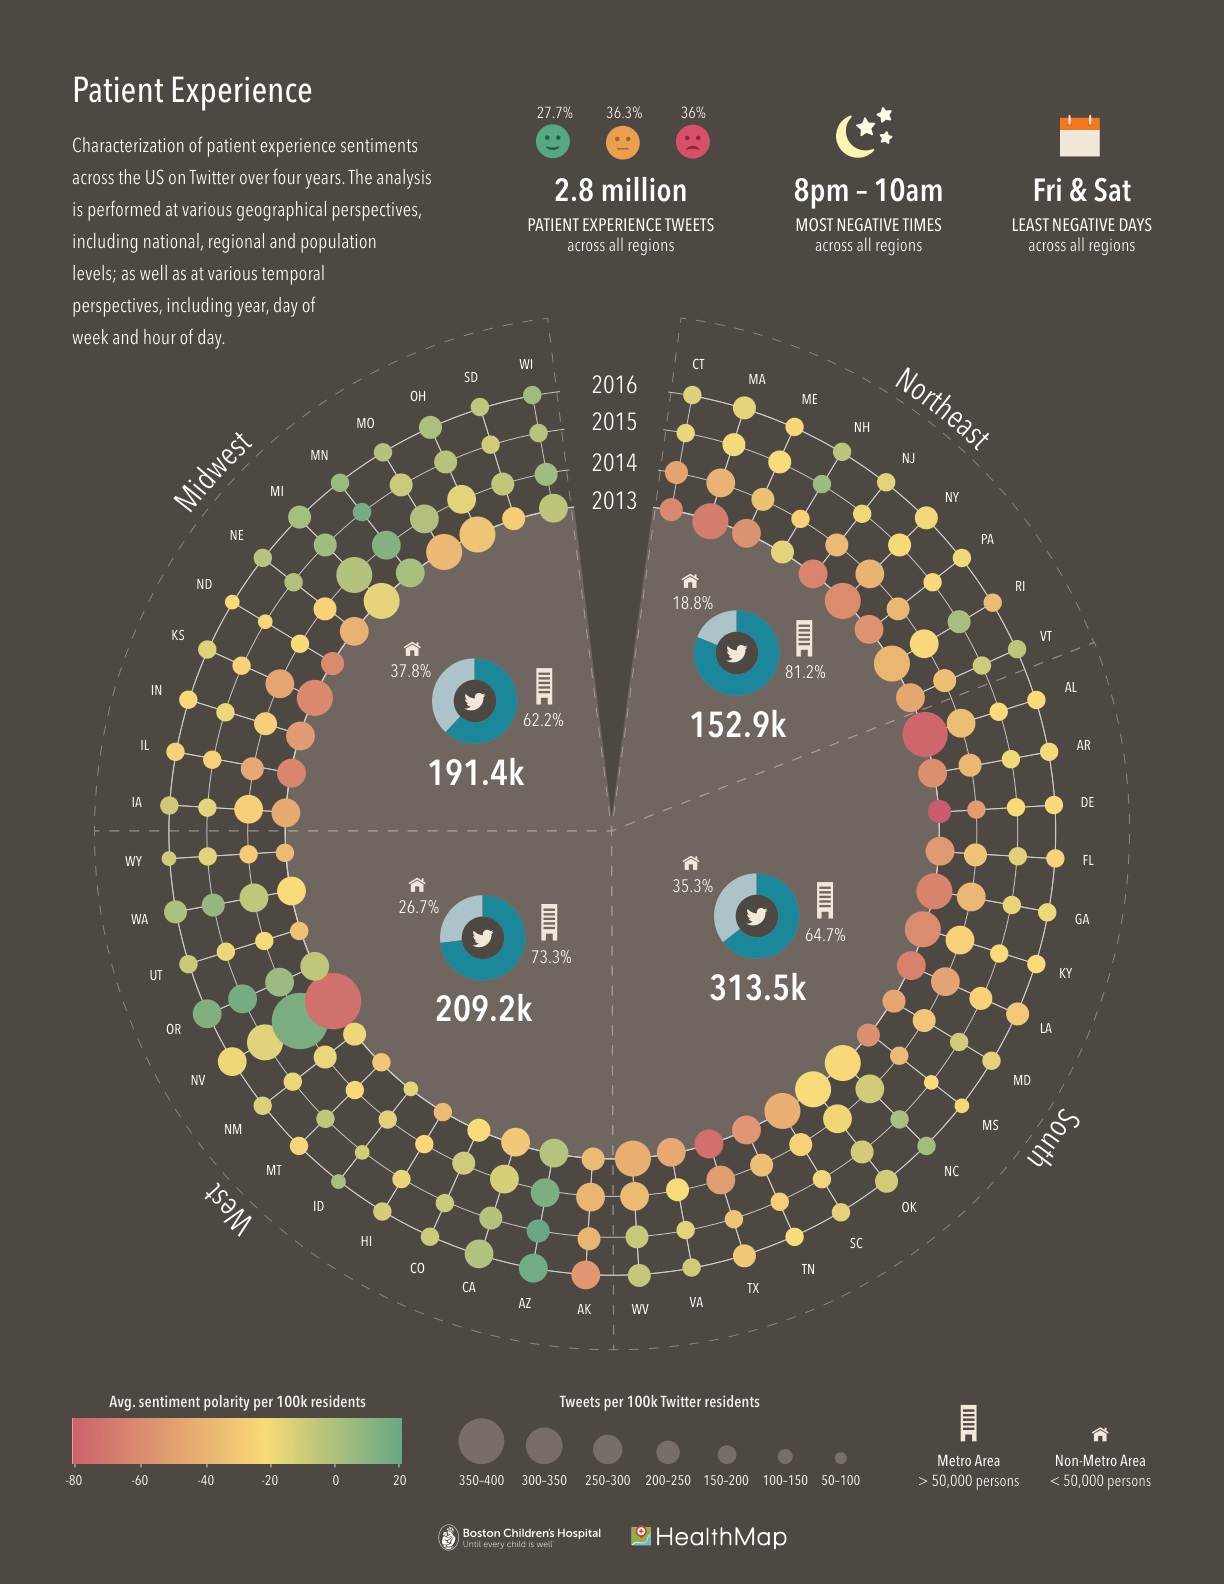
- Nationwide, ~36% of patient-experience tweets were negative, ~28% positive (2013–2017).
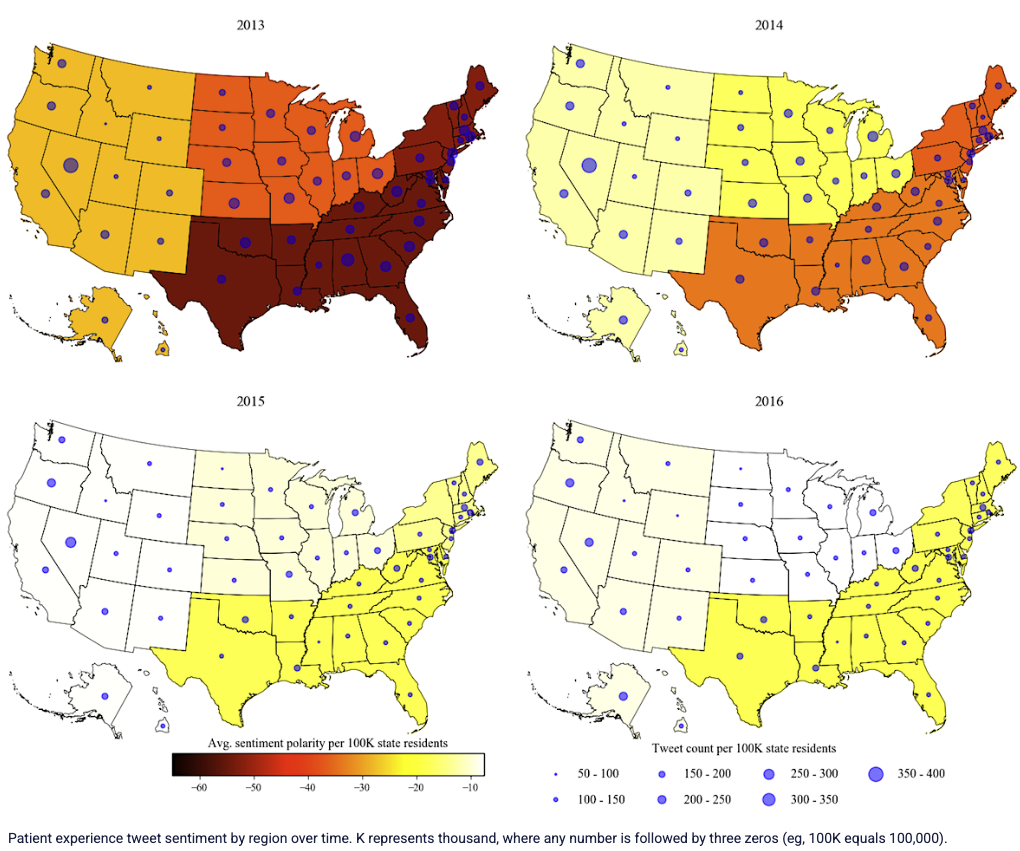
- Observed that overall sentiment became less negative over four years; night-time tweets were more negative than daytime.
- Found urban-area tweets showed more extreme sentiment (higher negativity) than rural tweets.
Skills and Tools Used
| Technique/Skill | Tools/Implementation |
|---|---|
| Big data processing | Twitter GNIP API (27 million tweets) |
| Natural language processing | NLTK/SVM for tweet classification, sentiment analysis |
| Crowdsourced annotation | Amazon Mechanical Turk labeling |
| Geospatial analysis | Google Maps API for state-level mapping |
| Statistical analysis | Regression, significance testing on trends |
Cross-Project Capabilities
- Twitter data pipeline and sentiment methods were reused in subsequent patient experience projects.
- Crowdsourced ML labeling approach (MTurk) was also used in the Gun Violence curation project.
- Geolocation and mapping techniques paralleled those in the Gun Violence platform.
Published Papers/Tools
- “Using Twitter to Examine Web-Based Patient Experience Sentiments in the United States: Longitudinal Study” (J. Med. Internet Res. 2018). Paper
- Code suite for tweet classification, geolocation, and sentiment analysis (developed for this study).